Google Cloud BigQuery Selecting Random Sample
Following is the sudo code to select random rows in Google Cloud BigQuery:
SELECT *

FROM {TABLE}

WHERE RAND() < {number of random rows}/{total rows}
Tableau Get Last Week Automatically
Below is the snippet to get last week automatically for dashboards to show all days of last week or values from last week only.
[Week]=str(

DATEPART('week',

DATEADD(

'day', -8,

DATETRUNC('week',TODAY())

)

)

)
[Week] Dimension can be added in filters and in filters under condition above snippet can be used.
Google BigQuery Group_Concat in Standard SQL
Google BigQuery provides a function (Group_Concat) to merge text in rows into one single row. It is an Aggregation Function and is supported in Legacy SQL.
It's equivalent in Standard SQL is String_Agg.
Streaming Data into Google BigQuery
Following is a step by step guide to stream live data into Google BigQuery
- Create a dataset in BigQuery under your project (http://bigquery.cloud.google.com)
- Set default expiry of the dataset to 1 day (or more)
- Create an empty template table e.g livestream
- Change default expiration of template table to 1 year (or more). Use command line to run following command
- bq update --expiration 31104000 dataset.livestream
- Setup a script to insert streaming data using Google SDK
- Recommended approach is to use templateSuffix while inserting data
- It creates a new table every time you change suffix (for example, hour, user id etc)
- No code required to create new table in your script
- It simplifies management of querying large datasets
- Remember:
- Data is not inserted in template table but in table_suffix (for example livestream_20170505)
- Do not delete template table
To get help on setting up streaming data into Google BigQuery Click Here.
To get help on setting up Google App Engine to process real-time data stream into BigQuery Click Here.
To get help on generating real time insights and visuals Click Here.
Installing IBM Netezza ODBC Drivers on AIX
AIX Version: 6.1 (64-bit)
Netezza NPS Version: 6.0.8
Pre-Requisites:
- NPS Client for AIX (Can be downloaded from FixCentral)
- DataDirect for AIX (Usually packaged with AIX ODBC drivers obtained from FixCentral)
- UTF8 installed on AIX
Steps:
- Extract NPS Client into a directory of choise
- Run ./unpack command to extract NPS client
- It should install Netezza ODBC drivers in /usr/local/nz
- untar DataDirect package
- Place odbc64v51 folder to /opt/
- Change the owner (CHOWN) to the application user or group who is going to use this
- Place .odbc.ini and .odbcinst.ini under user folder or at a share location where more than one user can access it
- Create odbc.ini link to .odbc.ini and odbcinst.ini to .odbcinst.ini
- Add following paths to user profiles
- LIBPATH =$LIBPATH:/opt/odbc64v51/lib:/usr/local/nz/lib64
- PATH =$PATH:/usr/local/nz/bin:/usr/local/nz/bin64
- NZ_ODBC_INI_PATH= [path to ini files]
- Goto /usr/local/nz/lib64 and create libnzodbc.so linked to libnzodbc.a (ln -s libnzodbc.a libnzodbc.so)
- Modify .odbc.ini and .odbcinst.ini to point to libnzodbc.so
- Change a variable "UnicodeTranslationOption" in .odbcinst.ini to UTF8
Last Day of Last Month and Last Day of Current Month in Teradata
Last day of last month:
select ADD_MONTHS(ADD_MONTHS((CURRENT_DATE - EXTRACT(DAY FROM CURRENT_DATE)+1),1)-1,-1)
Last day of current month:
select ADD_MONTHS((CURRENT_DATE - EXTRACT(DAY FROM CURRENT_DATE)+1),1)-1
Get First Day of Month and First Day of Last Month in Teradata
First day of last month:
select ADD_MONTHS(CURRENT_DATE - EXTRACT(DAY FROM CURRENT_DATE) + 1,-1)
First day of current month:
select CURRENT_DATE - EXTRACT(DAY FROM CURRENT_DATE) + 1
Creating Reusable Dashboards in Dashboard Design 4
There are two approaches of developing dashboards using Xcelsius or Dashboard Design (Version 4 and on-wards). These approaches are listed as follows:
- Build all your components in one Xcelsius file. Linking and drilling is done within the same scope of single xcelsius or dashboard design file
- Build all your components in one or more Xcelsius file. Linking can be done across XLF files and so is drilling. Use of openanalytics command maybe required or use of Load SWF component.
- Design your components with inputs and outpus in xcelsius and export them to BO platform. Use Dashboard Builder to paint the layout and do the linking using content linking available in dashboard builder
It is essential to make this design decision on development approach before development phase is started. Some of the factors to consider are:
- How many different layouts/views required by the client. Different views maybe required to faciliate various stakeholders across various departments. In this case creating a super set of xcelsius graph components and then building views using dashboard builder is a smarter way forward
- Whether customer requires a lot of filter parameters on components.
- Understand requirement on drilling. Does it require changing of complete layout. For instance, initially a dashboard may have two graphs. One with region and the other one on day. When drilled, customer may require both the graphs to change based on selected region and day.
These are only few considerations and you are the better judge on the approach as you have to meet the timelines and also to keep dashboards scale-able. Every dashboard requires re-finishing/final touch-ups due to the reason when it goes to customers they always have some feedback. Therefore, your design should be able to accommodate such ad-hoc requests which results in either changing the layout or changing the characteristics of graph linking, filters and drilling.
BOE Report Scheduler Asking for Context
Many SAP Business Objects 4 users have report scheduling complaints which are based on a universe designed in Information Design Tool and have a design that allows context selection. Issue is that when report is scheduled that can take two different paths, it ask for the context but available list of context is not displayed, resulting in the in-ability to schedule the report. Up-till SP4 (service pack 4) SAP has not released a fix for this and until that time, following are the do's and don't's for scheduling a report containing context choices:
- Create a new report and in the query panel set option to save the context choice
- Save the report
- Open the report and refresh the report using refresh icon on the top
- Select the context of choice
- Once report is refreshed, save it again
- Do not change the selection of the query objects in the query panel. Once you change objects and save it, you will not be able to schedule this report again. The only work around would be to re-create the report from scratch by following through step 1 to step 5
Good luck!
SAP Business Objects: Refreshing Structure in Information Design Tool
If Data Foundation Layer has already been developed or is being developed, then refreshing structure to reflect latest DB changes have to be done in following sequence:
- Take a backup of your project before proceeding with this process
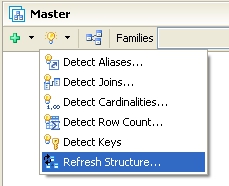
- Open Data Foundation Layer and select "Refresh Structure"

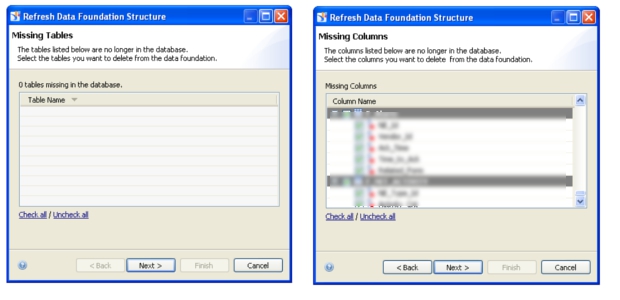
- Utility will gather information and will categorize changes into Missing Tables, Missing Columns, Added Columns, Modified Column. On each screen it will give you option to choose which changes to reflect


- Un-check all Missing Tables and Missing Columns. Take note of missing tables and missing columns. Check all Added Columns and Modified Columns
- Complete the process. This will update changed columns and add new columns
- Manually remove missing tables from your Data Foundation and also any relevant joins
- For missing columns, make sure they are not used in any joins. If so, you need to update joins and remove/change any columns which are removed from database
- Save your Data Foundation and back it up again to protect your progress
- Once you are sure that you have updated all the joins that contained missing columns, run Refresh Structure again. This time, it should not show you any Missing Table (since you removed them manually)
- Check all missing columns and proceed. It will remove all obsolete columns from your Data Foundation
- Now try to save your work. If Information Design Tool gives you a strange error/exception, that means you have not updated all the joins and there are still some joins containing missing columns.
- Restore your Data Foundation from latest backup and go through your joins again and make sure all missing columns have been removed from joins. You have to iterate this process until you are able to save successfully after removing missing columns by Refreshing Structure
- Once Data Foundation is updated and saved, update object definitions in Business Layer
This information is for SAP Business Objects 4 SP2. This approach is useful if you want to retain your aliases, contexts and joins while refreshing structure.