Teradata Query Banding In SAP Business Objects Information Design Tool
Usually customers require tracking and auditing of users and queries they are running on DWH/Teradata. There is no one way of tracking queries run by BI application users. An application user is not necessarily a Teradata user, therefore, query band is a useful feature for tracking logons and queries generated from BO and BO users. Queries are logged in DBQL along with necessary information. For instance:
- Application (Business Objects) username
- Universe name
- Document name
- etc (further details can be found in SAP BO documentation)
This is achieved using query banding feature provided in Teradata and is exploited in SAP Business Objects using 'BEGIN_SQL' parameter for SQL Generation. An example of BEIGN_SQL string is as follows:
SET QUERY_BAND='USER='@Variable('BOUSER');Document='@Variable('DPNAME')';' for transaction;
As per SAP documentation, it should work fine and it does work fine if you are using it in Universe Design Tool. But when used in Information Design Tool, it returns an error due to problem with SQL generation. Issue is due to @Variable function which returns a value enclosed in single quotes. For some reason, this is taken care of in Universe Design Tool but since Information Design Tool is new, it causes SQL error on Teradata.
Until SAP development team fixes this issue, a workaround can be used for query banding in Information Design Tool and that is to call a Teradata Stored Procedure in BEGIN_SQL and pass necessary parameters to it as inputs. Query band can then be set within the procedure.
For further details or queries, leave comments and we will reply.
Business Intelligence on Mobile
Businesses around the world have been facing a challenge of making right decision throughout the course of modern history. With time, need to make accurate decisions has become more dependent on availability of processed data. Digital age has gifted us with volumes of raw data and nightmare of getting actionable information out of it. Technological evolution of Teradata has enabled the world to process these volume of data and store it in a way that can be used to derive useful information for timely decisions. With this technology corporate are using information as an asset that is leading to higher profits. Decision makers have now started to expect availability of actionable information on the fly, hence, analytics are moving from desktop to mobile devices.
Need for Mobile BI:
Most of the companies so far have not focused on extending BI access to tactical work force. Most of the DWH and BI models are deployed keeping in mind analysts and middle level management. Nevertheless, need is being realized and in many industries analytical information is provided to front-line workers. For this work-force, access on mobile maybe critical. Let us take some real-life examples to understand this:
Retail: Large super stores have many point of sales. These POSes have cash drawers where cash is pilling up. Collecting this cash on regular intervals is usually important to avoid frauds etc. In this scenario, collection agents are on the move continuously and cannot sit on the computer to check desktop reports. A mobile based BI solution is required in this situation to optimize the collection of cash process as well as allow agents to monitor and act wisely.
Telecom: Where brains of the business and operation do not interact with customer directly that often, are required to set high level organisational objectives, which then are executed by front-line workers including call center, sales point/franchises and service centers. To effectively achieve set targets, it is important to delegate operational level decision making to front-line workers. For example, in call centers agents are always focused to sell additional services to existing customers. This effort can be made more effective by providing processed data (generated through BI) regarding a customer when he calls. Call center agent will be able to understand the customer interest and can offer services which customer will be more interested in.
Similarly, sales manager can monitor city-wise and area-wise sales statistics. Manager can take appropriate actions to meet daily sales target by monitoring sales data and can avoid target-miss. It becomes a pro-active approach to meet targets. Conventionally, reason of a daily target-miss would have been analysed the other day.
Technological Advancements:
Many Business Intelligence platforms are providing applications that can deliver graphs and dashboards on mobile devices. These tools use power of teradata to execute complex queries and store pre-aggregated data which then is used to generate visualizations (graphs, dashboards). Specially after Teradata introduced AEI (Active Enterprise Intelligence), theoretical pervasive BI architecture has now become a reality.
SAP Business Objects:
From the early days of Business Objects, they had something called Business Objects Mobile. It has two parts. First one is a component that needs to be installed on the server and the second one is a Java App which is installed on mobile devices. Same application has continued in later versions of SAP BO.
Installation: Once server component is deployed, mobile app can be downloaded over the air (OTA) using WiFi or Mobile Internet by accessing a URL. OTA installer is deployed with war file for Mobile.
Supported Devices: Following devices are supported by BO Mobile App.
- Blackberry OS v4.1, v4.2, v4.3, v4.5 and v4.6
- Symbian Series-60 3rd Edition
- Windows Mobile v5.0 with .Net Compact Framework v2.0 or above
- Windows Mobile v6.0 and v6.1
When installing, client app automatically detects type of mobile device.
SAP Business Objects Mobile and Business Objects Explorer can be used to deliver dashboards and reports on almost all mobile devices including iPhone and Android.
MicroStrategy:
MSTR desktop provides very flashy dashboards but they have introduced mobile component which can be used to deliver dashboards on mobiles phone.
Considerations:
- Number of decision makers using data from Teradata
- Number of managers
- Number of business areas covered
- Monitoring requirements
- Number of operational reports and tactical decision makers
- Competition in the market
- Realization of Business Intelligence as a competitive advantage
- Requirement for real-time data insights
- Focus on process optimization (operational or business)
Distinct Measures in Web Intelligence Report
Business intelligence teams across the world have been facing this problem of delivering reports with distinct measures since ages. Many solutions have been proposed and implemented but with increasing hunger of additional dimensions and thirst for quicker results, nothing can fully meet demands of evolving business users. Nevertheless, companies and BI developers are continuously making technological advancements to meet reporting requirements for DISTINCT based analysis. One such effort is done by SAP Business Objects by introducing a feature called "Database Delegate" in their BO XI R3.x version. This post focusing on describing and providing examples of using this feature:
Business Objects Database Delegate:
When designing a universe, many dimensions and measures are created. Measures are the calculated items that are analysed against different combinations of dimensions. When changing the set of dimensions for analysis in report (webi or deski), measure can be projected either using sum, avg, min max or count. These projections are defined while designing universe under measure properties (by double clicking a measure) and are re-calculated only on report level. Summarization process does not go beyond webi server and all the recalculations take place on webi server or locally if working in offline mode on rich client.
For distinct measures, non of the above mentioned summarization/projection function is appropriate i.e. sum, count, avg, min and max. By keeping a distinct count in an aggregate table and then counting them or summing them on report level will present incorrect values. For that matter a better approach would be:
- Keep a granular dimension in the aggregate. For example, you want to calculate distinct number of sessions in a day against different combination of dimensions. To achieve this, the aggregate design should hold a set of analytical dimensions, measures and a session key. This session key then can be used to create smart measures (explained later in the post) for calculating distinct measure correctly in webi reports
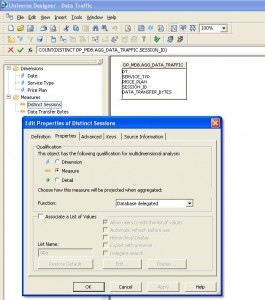
- While designing universe, use a new projection called Database Delegate, that is available in BO XI R 3.x , on distinct measures. For example, to calculate distinct number of sessions in webi, create a measure called 'Distinct Number of Sessions'. In the properties of this measure, set the projection function to 'Database Delegate'
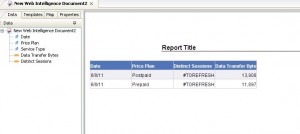
- In webi, what will happen is that, when you change combination of dimensions against which distinct is calculated, '#TOREFRESH' is displayed in Distinct column. This is webi telling report user to hit the refresh button again to recalculate distinct by delegating query to database that will recalculate distinct.
- Once a user has refreshed a report for different combinations of dimensions, user do not need to refresh webi report to analyse any of already refreshed combinations of dimensions for distinct measure.
Before using this projection function for your production reports, I would recommend to go through BO Designer guide for better understanding of limitations and precautions. Some considerations are as follows:
- Number of report users who will be using reports with 'Database Delegate' projections
- Data Warehouse or data mart processing capacity and average time taken to refresh a webi report containing 'Database Delegate'
- Frequency of webi report usage
- Permission sets assigned to webi report users. (In some cases, business users do not have refresh rights
Example:
Step 1: Create a simple aggregate table:
CREATE TABLE DP_MDB.AGG_DATA_TRAFFIC
(
	  DT DATE
	, SERVICE_TYP VARCHAR(10)
	, PRICE_PLAN VARCHAR(10)
	, SESSION_ID VARCHAR(20)
	, DATA_TRANSFER_BYTES INTEGER
)
PRIMARY INDEX(DT, SERVICE_TYP, PRICE_PLAN, SESSION_ID)
PARTITION BY RANGE_N(DT  BETWEEN DATE '2011-01-01' AND
DATE '2011-12-31' EACH INTERVAL '1' DAY );
Populate this newly created table with sample values:
INSERT INTO  DP_MDB.AGG_DATA_TRAFFIC
VALUES (CURRENT_DATE ,'GPRS', 'Prepaid','session00001',RANDOM(0,5000) );
INSERT INTO  DP_MDB.AGG_DATA_TRAFFIC
VALUES (CURRENT_DATE ,'VAS', 'Prepaid','session00001',RANDOM(0,5000) );
INSERT INTO  DP_MDB.AGG_DATA_TRAFFIC
VALUES (CURRENT_DATE ,'WAP', 'Prepaid','session00001',RANDOM(0,5000) );

INSERT INTO  DP_MDB.AGG_DATA_TRAFFIC
VALUES (CURRENT_DATE ,'MMS', 'Postpaid','session00002',RANDOM(0,5000) );
INSERT INTO  DP_MDB.AGG_DATA_TRAFFIC
VALUES (CURRENT_DATE ,'CONTENT', 'Postpaid','session00002',RANDOM(0,5000) );
INSERT INTO  DP_MDB.AGG_DATA_TRAFFIC
VALUES (CURRENT_DATE ,'SONGS', 'Postpaid','session00002',RANDOM(0,5000) );

INSERT INTO  DP_MDB.AGG_DATA_TRAFFIC
VALUES (CURRENT_DATE ,'GPRS', 'Postpaid','session00003',RANDOM(0,5000) );
INSERT INTO  DP_MDB.AGG_DATA_TRAFFIC
VALUES (CURRENT_DATE ,'CONTENT', 'Prepaid','session00003',RANDOM(0,5000) );
INSERT INTO  DP_MDB.AGG_DATA_TRAFFIC
VALUES (CURRENT_DATE ,'RINGTONE', 'Postpaid','session00004',RANDOM(0,5000) );
Step 2: Create a universe for this aggregate in business objects designer and create following objects:
- Date
- Service Type
- Price Plan
- Distinct Sessions
- Data Transfer Bytes
Go to the properties of 'Distinct Sessions' and select 'Database Delegated'. This option is available under 'Choose how this measure will be projected when aggregated'. For further details, see the below screenshot:
Step 3: Save and export after validating universe.
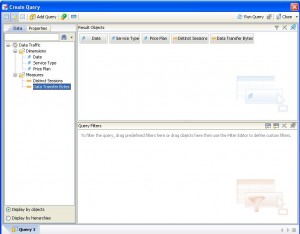
Step 4: Create a Webi report using the newly created universe using following objects:
- Date
- Service Type
- Price Plan
- Distinct Sessions
- Data Transfer Bytes
and run the report.
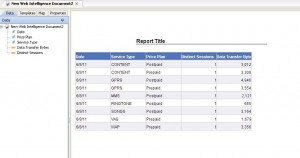
Values of all measures are visible including distinct sessions.
Step 5: Try removing dimensions to see how it effects calculation of measures i.e. Distinct Session and Data Transfer Bytes
Removing Service Type dimension results in following:
- Data Transfer Bytes are summed against new combination of dimensions
- Whereas, Distinct Sessions are not summed up or averaged out. Instead, webi is displaying #TOREFRESH message and suggesting report user to refresh the report in order to get recalculated values from database against the new set of dimensions
Conclusion:
This new feature can be very useful if used properly and with right approach. It is a step forward towards solving inconsistent and incorrect calculation of distinct measures by business/end users. It is hoped that more such features will be introduced in coming version and bugs will be removed. Currently there are few bugs in this feature when using with specific databases like Teradata. These bugs will be discussed in future along with possible work arounds until SAP formally releases a fix pack to answer known bugs.
